

UK Services Are Growing. So Where Are the Jobs?
UK services remain in expansion, but employment continues to fall. Technology-related activity is relatively strong and spending on AI tools is rising rapidly. The evidence does not show that AI is causing weaker employment, but it raises an important question: can some firms increasingly expand output without adding headcount at the same rate?
UK growth is holding up — but the composition matters
The UK services sector remained in expansion in September, with the final Services PMI at 52.1. On the surface, that is a relatively straightforward story: activity is still growing. Beneath the headline, however, there is a more interesting development.
Technology services have been one of the stronger areas of demand, while services employment has continued to fall. September marked the 24th consecutive month of declining services employment. That creates an important question: how is output continuing to expand while employment is moving in the opposite direction?
Technology is a bright spot
Official data support the signal from the surveys. ONS data show that computer programming, consultancy and related activities grew by 3.5% in July and by 4.4% over the three months to July.
The ONS also noted that some businesses reporting the largest increases in turnover within computer programming and information services were involved in artificial intelligence and cloud computing. This does not tell us how much sector growth is being caused by AI, but it provides another piece of evidence that digital investment is feeding into real economic activity.
Follow the money
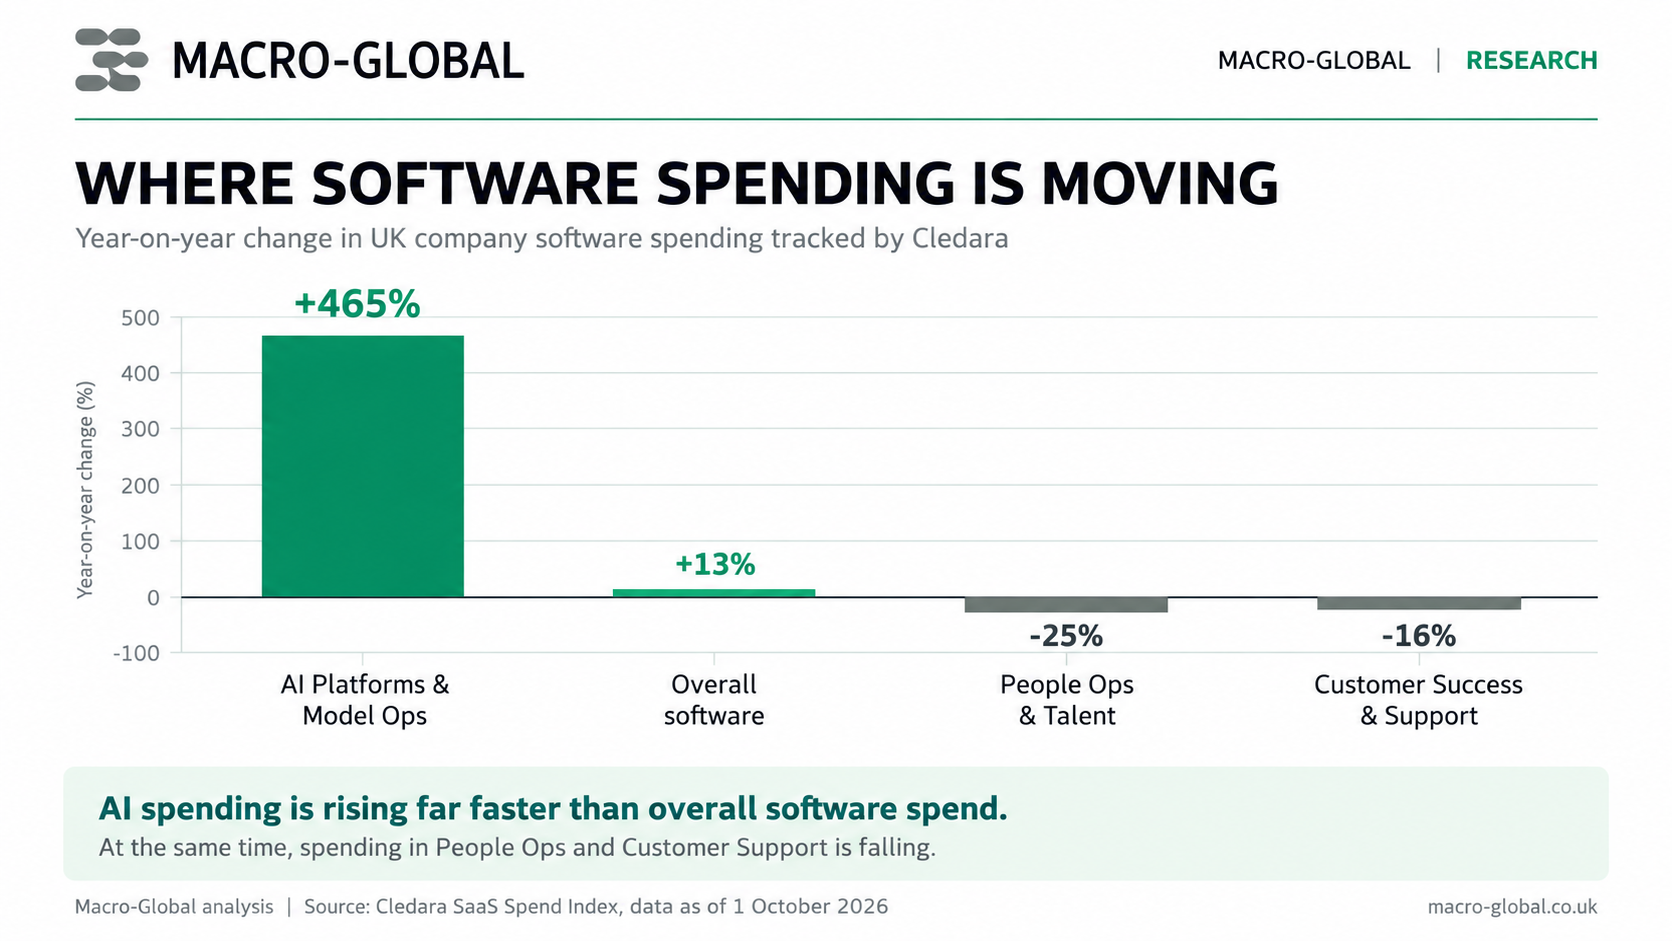
Software spending offers another view of AI adoption. Cledara data show AI Platforms & Model Ops spending rose 465% year-on-year, compared with a 13% increase in overall software spending. Meanwhile, spending on People Ops & Talent fell 25% and Customer Success & Support fell 16%.
These movements do not prove that AI spending is replacing recruitment or employment. The categories capture different types of business expenditure and do not establish causality. They do, however, show a shift in spending priorities that is worth watching.
The jobs question
This is where the evidence becomes more interesting when viewed together. Services activity is expanding, technology-related activity is relatively strong and businesses are rapidly increasing expenditure on AI tools, while services employment continues to decline.
There are many possible explanations for weak hiring, including subdued demand, elevated labour costs, economic uncertainty and cautious recruitment. It would therefore be premature to attribute the employment weakness to AI. However, there is another possibility worth testing as AI adoption spreads through the economy:
Could some businesses increasingly expand output without increasing headcount at the same rate?
If that pattern begins to emerge, the implications extend beyond the technology sector. Higher productivity could raise potential growth and living standards. But if technological adoption also reduces demand for some entry-level, administrative or routine professional roles, it could alter traditional pathways into skilled employment.
That makes the AI debate about more than productivity. It becomes a question about productivity, wages, skills, employment and who ultimately captures the gains from technological change.
What Macro-Global will be watching
The next test is whether this divergence persists across the data: output and productivity, business technology expenditure, vacancies, graduate recruitment, employment and wages. One month’s data cannot answer the question. But if output continues to grow while employment growth remains unusually weak — particularly in sectors experiencing rapid technological adoption — the relationship will become increasingly important for businesses, policymakers and financial markets.
The question is no longer simply how quickly businesses adopt AI. It is what happens to productivity and employment when they do.
Sources: S&P Global UK Services PMI; Office for National Statistics; Cledara SaaS Spend Index (data as of 1 October 2026).
Comments